
Python:Google Analytics Reporting API 快速入門
本文教 Analytics Reporting API v4 的 Python 快速指南,使用服務帳戶(Service application)取得報表資料,大部分都是程式碼,說明較少。
啟用 GCP 服務
1. 啟用 API
在開始前要先啟用 Analytics Reporting API v4 。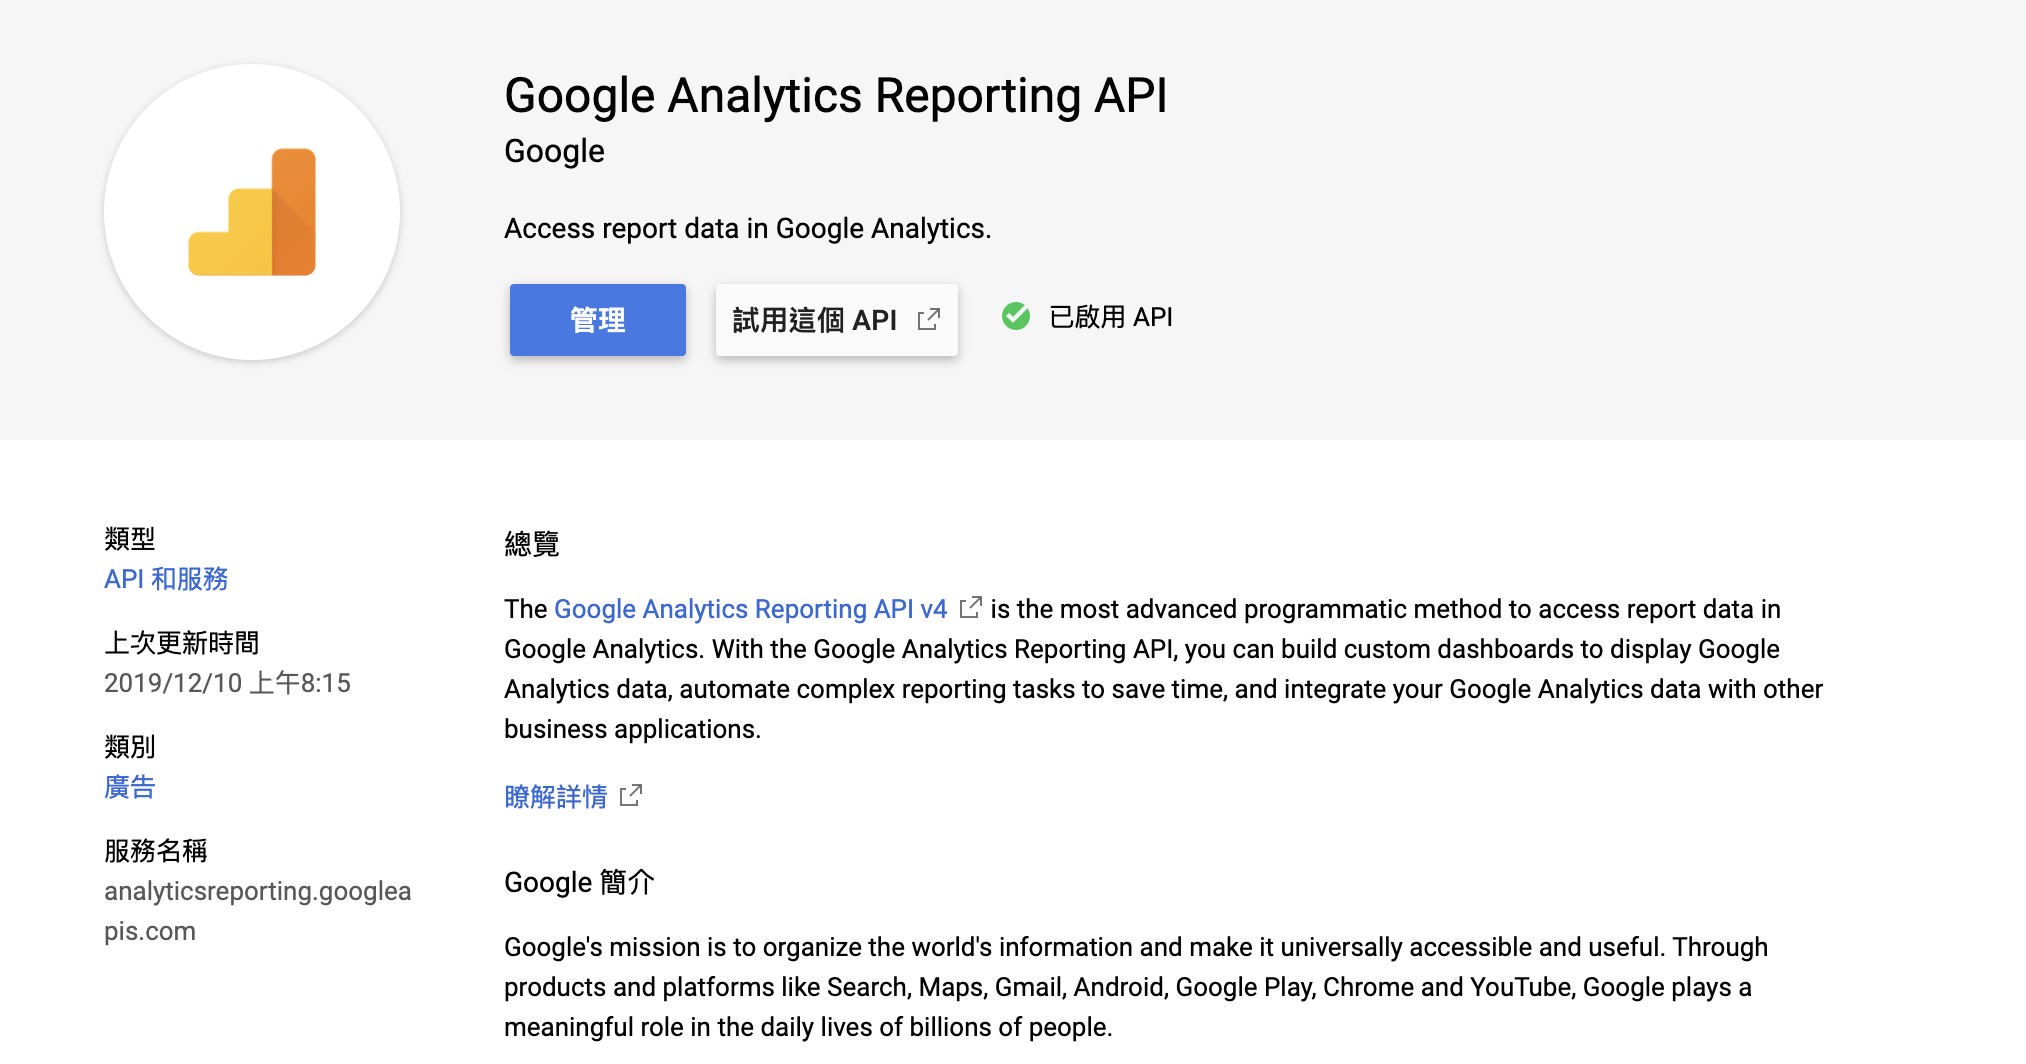
2. 建立服務帳戶
在 GCP 的API 和服務 > 憑證 建立服務帳戶金鑰,並選擇或新增服務帳戶,將產生的 json 金鑰存到本機。
3. 權限設置
將此服務帳戶添加至 Google Analytics 報表中,檢視及分析權限即可,服務帳戶類似於以下的電子郵件地址:
Python
所需套件
google-oauth2-tool
google-api-python-client
取報表函數
from apiclient.discovery import build
from google.oauth2.service_account import Credentials

SCOPES = ['https://www.googleapis.com/auth/analytics.readonly']
KEY_FILE_LOCATION = '<JSON_FILE>'

def get_service():
    """
    Build Analytics Reporting API V4 service object.
    """
    credentials = Credentials.from_service_account_file(
        KEY_FILE_LOCATION, scopes=SCOPES
    )
    service = build(serviceName='analyticsreporting', version='v4', credentials=credentials)
    return service

def get_report(
    service, view_id,
    start_date='7daysAgo', end_date='yesterday',
    metrics=[], dimensions=[]
    ):
    return service.reports().batchGet(
            body={
                'reportRequests': [{
                    'viewId': view_id,
                    'dateRanges': [{'startDate': start_date, 'endDate': end_date}],
                    'metrics': [{'expression': m} for m in metrics],
                    'dimensions': [{'name': d} for d in dimensions],
                }]
            }).execute()
使用
VIEW_ID = '<VIEW_ID>'
metrics = ['ga:sessions']
dimensions = ['ga:source', 'ga:medium']
start_date, end_date = '7daysAgo', 'yesterday'

service = get_service()
response = get_report(
                service, VIEW_ID,
                start_date, end_date,
                metrics, dimensions
                )
response 轉 DataFrame
def res_to_df(res):
    report = res['reports'][0]
    dimensions = report['columnHeader']['dimensions']
    metrics = [m['name'] for m in report['columnHeader']['metricHeader']['metricHeaderEntries']]
    headers = [*dimensions, *metrics]

    data_rows = report['data']['rows']
    data = []
    for row in data_rows:
        data.append([*row['dimensions'], *row['metrics'][0]['values']])

    return pd.DataFrame(data=data, columns=headers)

df = res_to_df(response)